Observability
Metrics
We collect cluster metrics with Prometheus, deployed with the Prometheus Operator. Alongside it, we run Alertmanager, Node exporter, kube-state-metrics, and more. Components expose their metrics to Prometheus with ServiceMonitor and PodMonitor resources, including the Envoy proxies of our Istio ingress gateways and waypoints.
Logs
We collect logs with Alloy, which collects container logs and Kubernetes cluster events and pushes them to Loki. Loki stores its data in S3-compatible object storage that Ceph provides1.
Dashboards & Alerting
Grafana allows us to query, visualize, and alert on our metrics and logs. We deploy it with the Grafana Operator, so our dashboards, datasources, and alerting configuration are all custom resources stored in git. Grafana is backed by a CloudNativePG PostgreSQL cluster, and alerts are sent to Discord.
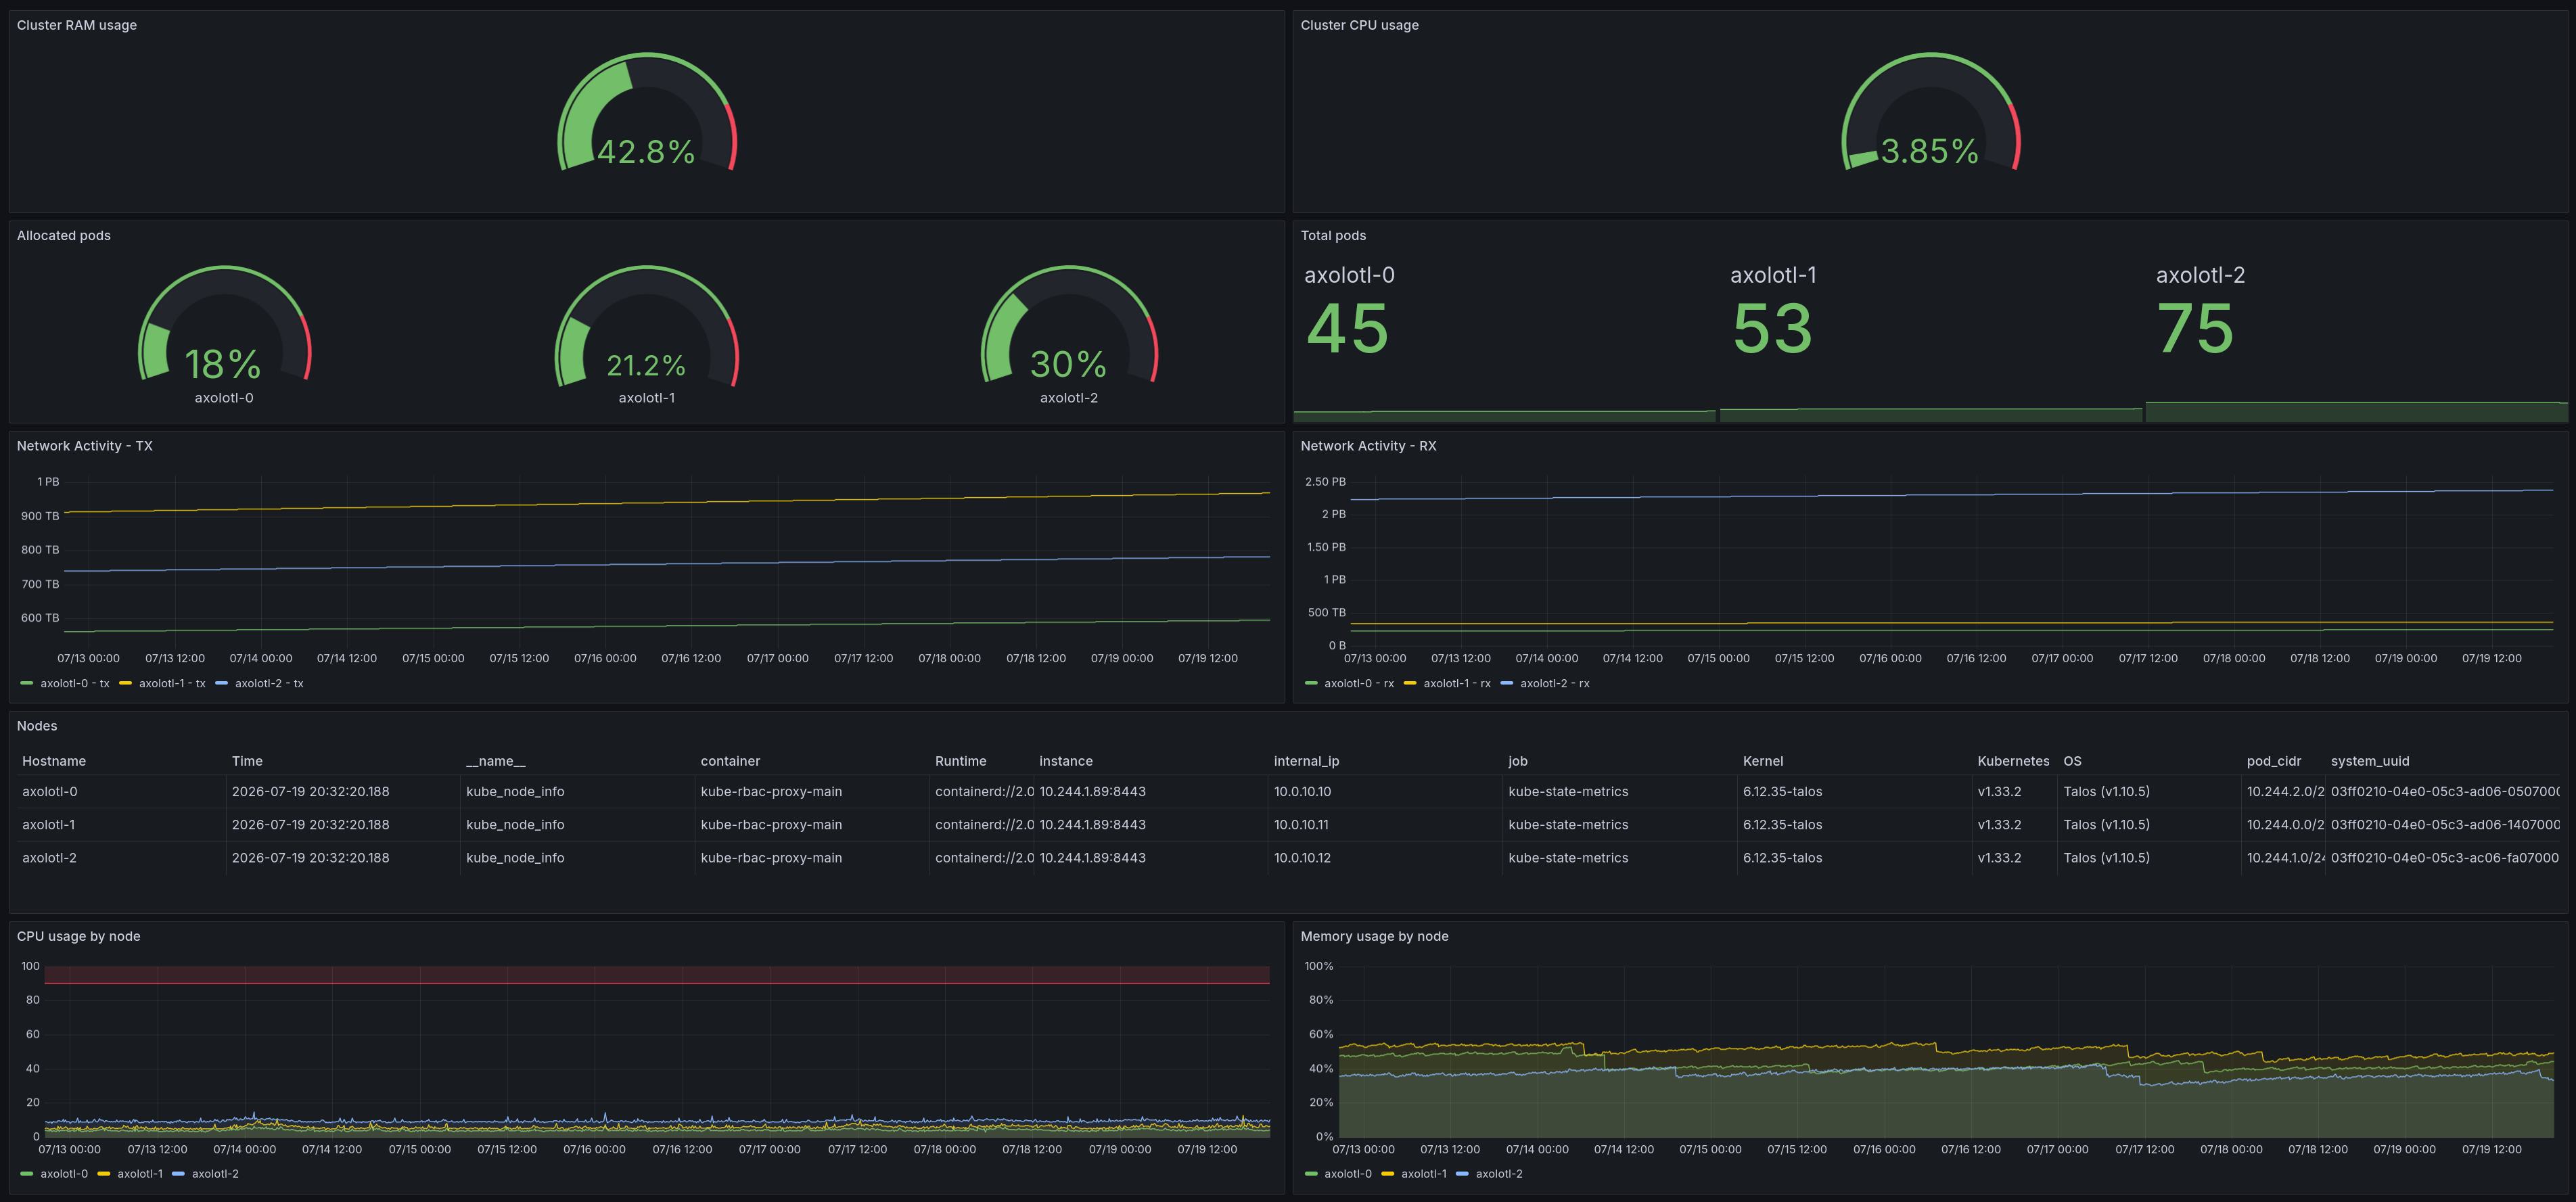
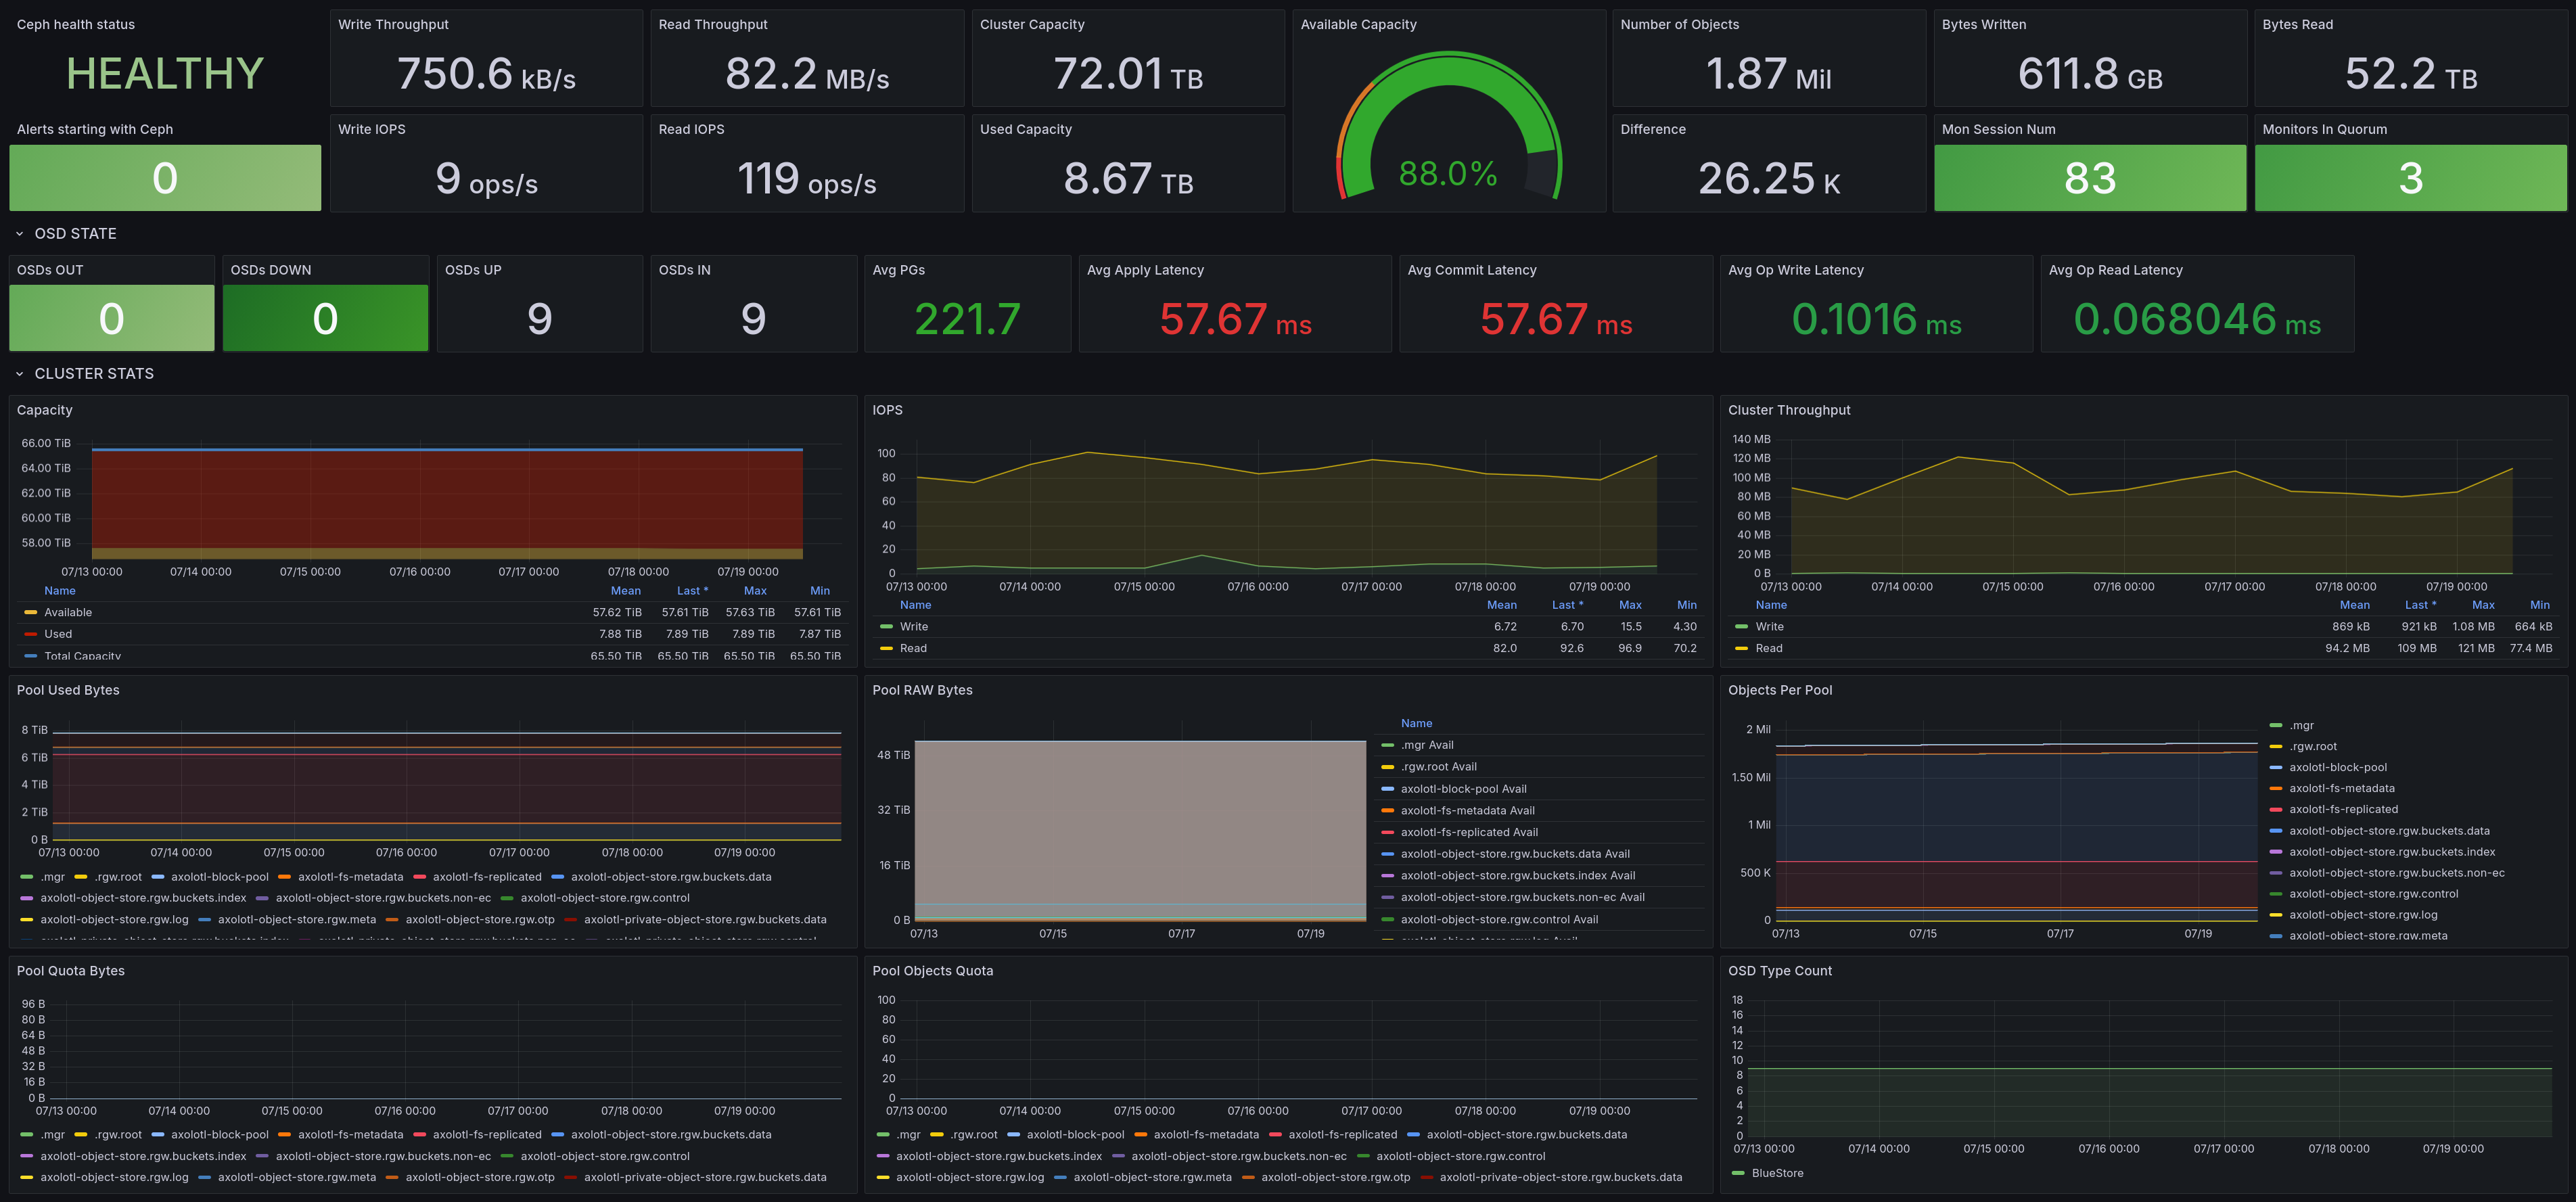
Here are a couple of example dashboards:
Network & Mesh
Hubble provides visibility into network flows, and Kiali visualizes traffic in the service mesh. Learn more about both on the networking page.
Future Plans
In the future, we plan to expand our alerting coverage and look into distributed tracing with Tempo.
-
Learn more about our Ceph cluster on the storage page. ↩